peacefulIndicatorsWe are delighted to present the PeacefulIndicators library, a modest yet powerful collection of custom technical indicators created to enhance your trading analysis. The library features an array of practical tools, including MACD with Dynamic Length, Stochastic RSI with ATR Stop Loss, Bollinger Bands with RSI Divergence, and more.
The PeacefulIndicators library offers the following functions:
macdDynamicLength: An adaptive version of the classic MACD indicator, which adjusts the lengths of the moving averages based on the dominant cycle period, providing a more responsive signal.
rsiDivergence: A unique implementation of RSI Divergence detection that identifies potential bullish and bearish divergences using a combination of RSI and linear regression.
trendReversalDetection: A helpful tool for detecting trend reversals using the Rate of Change (ROC) and Moving Averages, offering valuable insights into possible market shifts.
volume_flow_oscillator: A custom oscillator that combines price movement strength and volume to provide a unique perspective on market dynamics.
weighted_volatility_oscillator: Another custom oscillator that factors in price volatility and volume to deliver a comprehensive view of market fluctuations.
rvo: The Relative Volume Oscillator highlights changes in volume relative to historical averages, helping to identify potential breakouts or reversals.
acb: The Adaptive Channel Breakout indicator combines a moving average with an adjustable volatility multiplier to create dynamic channels, useful for identifying potential trend shifts.
We hope this library proves to be a valuable addition to your trading toolbox.
Library "peacefulIndicators"
A custom library of technical indicators for trading analysis, including MACD with Dynamic Length, Stochastic RSI with ATR Stop Loss, Bollinger Bands with RSI Divergence, and more.
macdDynamicLength(src, shortLen, longLen, signalLen, dynLow, dynHigh)
Moving Average Convergence Divergence with Dynamic Length
Parameters:
src (float) : Series to use
shortLen (int) : Shorter moving average length
longLen (int) : Longer moving average length
signalLen (int) : Signal line length
dynLow (int) : Lower bound for the dynamic length
dynHigh (int) : Upper bound for the dynamic length
Returns: tuple of MACD line and Signal line
Computes MACD using lengths adapted based on the dominant cycle period
rsiDivergence(src, rsiLen, divThreshold, linRegLength)
RSI Divergence Detection
Parameters:
src (float) : Series to use
rsiLen (simple int) : Length for RSI calculation
divThreshold (float) : Divergence threshold for RSI
linRegLength (int) : Length for linear regression calculation
Returns: tuple of RSI Divergence (positive, negative)
Computes RSI Divergence detection that identifies bullish (positive) and bearish (negative) divergences
trendReversalDetection(src, rocLength, maLength, maType)
Trend Reversal Detection (TRD)
Parameters:
src (float) : Series to use
rocLength (int) : Length for Rate of Change calculation
maLength (int) : Length for Moving Average calculation
maType (string) : Type of Moving Average to use (default: "sma")
Returns: A tuple containing trend reversal direction and the reversal point
Detects trend reversals using the Rate of Change (ROC) and Moving Averages.
volume_flow_oscillator(src, length)
Volume Flow Oscillator
Parameters:
src (float) : Series to use
length (int) : Period for the calculation
Returns: Custom Oscillator value
Computes the custom oscillator based on price movement strength and volume
weighted_volatility_oscillator(src, length)
Weighted Volatility Oscillator
Parameters:
src (float) : Series to use
length (int) : Period for the calculation
Returns: Custom Oscillator value
Computes the custom oscillator based on price volatility and volume
rvo(length)
Relative Volume Oscillator
Parameters:
length (int) : Period for the calculation
Returns: Custom Oscillator value
Computes the custom oscillator based on relative volume
acb(price_series, ma_length, vol_length, multiplier)
Adaptive Channel Breakout
Parameters:
price_series (float) : Price series to use
ma_length (int) : Period for the moving average calculation
vol_length (int) : Period for the volatility calculation
multiplier (float) : Multiplier for the volatility
Returns: Tuple containing the ACB upper and lower values and the trend direction (1 for uptrend, -1 for downtrend)
Buscar en scripts para "relative volume"

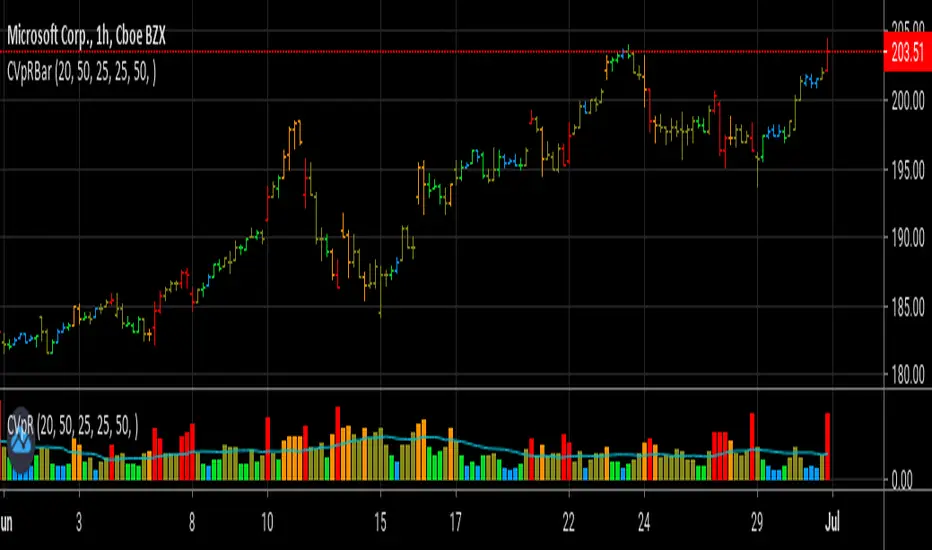
Volume Prism RibbonNASDAQ:SPWR
The purpose of this script is to give insight into the volume action. The relative volume is calculated (based on 400 ticks) with the volume of down days (close-close <0) being given a negative value. This function is then summed over 100 ticks. WMA's are used to generate a rainbow ribbon who's color order is easily recognized buy all of us. Watch and Warning points are added using crossover points. I find it to be a good supplement to my favorite Buy/Sell indicator. In addition to the wrapping of the ribbon, pay attention to where the zero line is as well.

Volume, Simple Relative Volume HighlightThis script plots volume bars and highlight bars that have an unusual activity, compare to the average (Standard: Simple Moving Average, 50 periods).
The script is useful for checking daily volume levels on equities. Where there is high volume, there is likely volatility, wich is good for day trading and swing trading entries.

Volume Bubbles by EV Volume Bubbles visualizes high-activity candles using chart bubbles placed at an estimated intrabar origin point derived from lower timeframe data. When enabled, the script uses lower timeframe OHLC to approximate directional volume delta and selects an origin candle inside the parent bar using one of several methods. A relative-volume filter based on the parent bar can be used to reduce noise, and bubble size can be mapped to relative volume to highlight unusually active bars. If intrabar data is unavailable, the script can fall back to placing bubbles on the parent bar to keep behavior consistent. For best stability, the “Only confirmed bars” option is recommended.

Mashrab | Momentum X-Ray Stop guessing if a stock is a "Leader" or a "Laggard." The Mashrab Momentum X-Ray is a professional Heads-Up Display (HUD) that tells you the true strength of any stock in seconds.
Designed for serious swing traders and breakout specialists (similar to the styles of Qullamagie, Mark Minervini, and IBD), this tool ignores the noise and focuses on the only things that matter: Relative Strength, Volume Fuel, and Fundamental Health.
🚀 Key Features (What it does)
1. The "Smart" Relative Strength Engine
Most indicators blindly compare every stock to the S&P 500. This dashboard is smarter.
It automatically scans the stock’s Industry (e.g., Semiconductors, Gold Miners, Regional Banks).
It compares the stock’s performance against its specific peers (e.g., NVDA vs. SMH ETF) and the market benchmark (SPY).
Green Signal: The stock is beating both the market and its sector. This is a "True Leader."
2. IBD-Style RS Rating (1-99 Scale)
Get the "Secret Sauce" of institutional screening directly on your chart.
Calculates a weighted performance score: 40% (Last 3 Months) + 20% (6m, 9m, 12m).
The Scale:
90–99 (Lime Green): Elite Super-Stock.
80–89 (Green): Strong Leader / Breakout Candidate.
< 50 (Red): Laggard / Avoid.
3. Momentum "Fuel" Gauge (RVol)
Price moving up is good. Price moving up on massive volume is better.
The RVol (Relative Volume) row lights up Yellow or Purple when volume is 1.5x to 3x higher than normal. This detects "Institutional Buying" footprints.
4. "Blue Sky" Detector
Instantly see how close the price is to its 52-Week High.
Stocks within 5% of their highs (Green) have no "overhead supply" (bag holders) and can run the fastest.
👀 How to Read the Dashboard
Top Table (Tactical Momentum)
RS vs SPY / Sector: Look for DOUBLE GREEN. This means the stock is the "King of the Hill."
RVol: Look for > 1.5x (Yellow). This means big players are entering the trade.
Bottom Table (Strategic Context)
IBD RS Rating: Look for a score of 80 or higher.
ADR (20): Shows the "Average Daily Range" volatility. (e.g., 4.5% means the stock moves ~4.5% a day). Use this to size your position correctly!
Industry: Tells you exactly which ETF is being used for comparison (e.g., "Semiconductors (SMH)").
⚙️ Settings & Customization
Benchmark: Change the default SPY to QQQ (for Tech), IWM (for Small Caps), or BTCUSD (for Crypto) to fit your strategy.
Lookback: Defaults to 26 Bars (Standard Monthly Momentum), but fully adjustable.
Text Size: Make the tables larger or smaller to fit your screen.
"Trade the Leaders, Ignore the Laggards."

EY DashboardThe Easy Portfolio Dashboard is a high-performance, real-time monitoring tool designed for traders managing multiple positions. Unlike standard tables, this script is optimized using User-Defined Types (UDT) and Array-based rendering to ensure the lowest possible latency and 100% compliance with TradingView’s security-call limits. It allows you to track up to 24 symbols simultaneously, showing price action, volatility (ATR), relative volume, and upcoming earnings.
Key Features
Automatic Ticker Formatting: Strips exchange prefixes (e.g., BATS:, NASDAQ:) to keep your UI clean and focused on the ticker name.
Intelligent P&L Tracking: Real-time calculation of daily profit/loss based on your specific share quantities.
Volatility Alerts (ATR %): Visual color-coding (Green/Yellow/Red) based on the stock's current ATR relative to its price.
Earnings Countdown: Highlighted countdown timer for upcoming earnings reports, with red alerts when an event is less than 7 days away.
Net Worth Engine: A dedicated summary section that combines your current equity with a manual Cash (USD) input to track total account value.
How to Use
Ticker Input: Enter your symbols (e.g., AAPL, TSLA) and the number of shares you own in the Inputs tab.
Cash Settings: Enter your current uninvested cash balance in the Cash Settings section to calculate your total Net Worth.
UI Customization:
Position: Choose between 9 different screen locations (Top Right, Bottom Center, etc.).
Minimal Mode: Toggle this to hide the detailed ticker list and show only the P&L and Net Worth summary.
Toggle Columns: Enable or disable columns for ATR, Volume, and Earnings as needed.
Technical Methodology
Data Sourcing: All data is fetched using request.security on a Daily ("D") timeframe.
Security Handling: The script uses a "Global Fetch" architecture. This satisfies the compiler requirement that security calls must be at the top level, while the UI is handled by a dynamic loop for efficiency.
ATR Calculation: Calculated as (ATR(14) / Price) * 100 to show the "expected move" as a percentage of the stock price.
Volume Analysis: Compares current volume to a 20-period SMA of volume to identify unusual activity.
Settings Glossary
ATR Red Threshold: The percentage at which the ATR emoji turns Red (High volatility/risk).
ATR Yellow Threshold: The percentage at which the ATR emoji turns Yellow (Moderate volatility).
Next ER: Displays the days remaining until the next Earnings Report. Cells turn red when an ER is imminent (within 1 week).

Hybrid Smart Money Concepts [MarkitTick]💡This indicator provides a comprehensive technical analysis system that combines Market Structure concepts (Smart Money Concepts) with advanced Gap Analysis and a statistical Stress Model. It is designed to help traders identify trend direction, structural pivot points, potential reversal zones (Order Blocks), significant price gaps, and moments of market exhaustion.
Unlike standard ZigZag or Fractal indicators, this script integrates volume, trend maturity, and statistical volatility (Z-Score) to contextually classify price action. By overlaying these elements with a robust Market Structure engine—which identifies Change of Character (CHoCH) and Order Blocks—the tool provides a confluent view of price action.
It automates the detection of institutional footprints, allowing traders to see the structural trend, momentum drivers, and potential exhaustion points simultaneously.
● METHODOLOGY
The script operates on three distinct but complementary logic engines:
• Gap Analysis Engine
This module detects gaps between the previous high/low and the current open. It classifies them into three specific types based on volume and structural context:
Breakaway Gaps: Identified when a gap creates a breakout above a recent Pivot High or below a Pivot Low. This signals the start of a potential new trend.
Exhaustion Gaps: Identified when a gap occurs with high relative volume and meets the Trend Maturity criteria. This often signals the end of a trend.
Runaway Gaps: Standard continuation gaps that occur within a trend.
• Market Structure Engine
Swings and CHoCH: The script uses a left-and-right bar lookback to identify Pivot Highs and Lows. A Change of Character (CHoCH) is plotted when price closes beyond the most recent major pivot.
Order Blocks (OB): Upon a continuation of the trend, the script scans backward to find the extreme candle (the origin of the move) and highlights this zone as an Order Block.
Dynamic Cleanup: Gaps and Order Blocks are automatically removed (mitigated) when price aggressively crosses through their levels.
• Exhaustion & Stress Model
This statistical engine measures market "Stress" by analyzing the impact of price range relative to volume (True Range / Volume).
Calculation: It calculates a Z-Score (Standard Deviation) of this impact.
Logic: When the Z-Score exceeds a specific threshold (Sigma), it indicates a statistical anomaly or "Stress."
Signal: If high stress occurs while price is significantly above the trend baseline, it signals "Buyer Exhaustion." Conversely, high stress below the baseline signals "Seller Exhaustion."
● VISUALS & LEGEND
Before trading, you need to know what the indicator is drawing on your chart:
• Change of Character (CHoCH)
Green Dashed Line: Indicates a Bullish reversal.
Red Dashed Line: Indicates a Bearish reversal.
• Order Blocks (OB)
Green Boxes: Bullish support zones (Buy interest).
Red Boxes: Bearish resistance zones (Sell interest).
Note: Invalidated boxes are automatically deleted.
• Gaps
Blue Box (Breakaway): Strong momentum gap starting a new trend.
Orange Box (Runaway): Continuation gap.
Red Box (Exhaustion): Warning signal; trend may be ending.
• Stress Model Signals
Label "BE" (Red): Buyer Exhaustion. Suggests the bullish move is overextended relative to volume participation.
Label "SE" (Green): Seller Exhaustion. Suggests the bearish move is overextended.
● TRADING STRATEGY
You can use a "Pullback, Continuation & Exhaustion" strategy with this indicator.
• Scenario A: Long Setup (Buying)
Trend Change: Look for a CHoCH label with a Green Dashed Line.
Entry Zone: Look for a Green Order Block (OB) to form.
Confirmation: A Breakaway Gap (Blue) validates the breakout.
Entry: Enter Long when price pulls back into the Green OB.
Exit Warning: If a "BE" (Buyer Exhaustion) label appears, consider tightening stops or taking profit.
• Scenario B: Short Setup (Selling)
Trend Change: Look for a CHoCH label with a Red Dashed Line.
Entry Zone: Look for a Red Order Block (OB) to form.
Confirmation: A Breakaway Gap downwards validates the move.
Entry: Enter Short when price rallies back into the Red OB.
Exit Warning: If an "SE" (Seller Exhaustion) label appears, consider tightening stops or taking profit.
● SETTINGS
• Date Range Filter
Use Date Filter: Toggle time-based filtering.
Start Date: Timestamp to begin calculations.
• Gap Analysis
Min Gap Size: Minimum points required to register a gap.
Logic Inputs: Configures lookback periods and volume multipliers for gap classification.
Visuals: Customize colors for Breakaway, Runaway, and Exhaustion gaps.
• Market Structure
Swing Detection Length: Lookback period for pivot points.
Show CHoCH: Toggle for Change of Character labels.
Show Order Blocks: Toggle for OB boxes.
• Exhaustion & Stress Model
Trend Filter Length: Baseline length for determining trend direction (EMA).
Statistical Lookback: Length for the Z-Score calculation.
Stress Threshold (Sigma): The standard deviation requirement to trigger an exhaustion signal (Default: 2.0).
● DISCLAIMER
All provided scripts and indicators are strictly for educational exploration and must not be interpreted as financial advice or a recommendation to execute trades. I expressly disclaim all liability for any financial losses or damages that may result, directly or indirectly, from the reliance on or application of these tools. Market participation carries inherent risk where past performance never guarantees future returns, leaving all investment decisions and due diligence solely at your own discretion.

Supply & Demand Zones (Volume-Based)📌 Supply & Demand Zones (Volume-Based) — Indicator Description
Overview
This indicator visually highlights potential supply and demand price zones using historical candle structure combined with relative volume behavior.The zones are intended to help users observe areas of increased market activity where price has previously reacted. This tool is designed for visual analysis only.
How the Zones Are Identified
Demand zones are highlighted when price shows a strong bullish reaction following a bearish candle.Supply zones are highlighted when price shows a strong bearish reaction following a bullish candle.Relative volume is used as context, not as a predictive input, to classify zones into higher or lower activity levels.Zones automatically invalidate when price structurally breaks them.
About the Percentage Display
The percentage shown on a zone represents normalized relative volume strength at the time the zone was formed.This value is not a probability, not a success rate, and not a performance metric.It should not be interpreted as a prediction or trading signal.Percentages are displayed only for active zones and are removed once a zone is invalidated.
How This Indicator Is Intended to Be Used
As a visual reference tool for identifying historical supply and demand areas.As a contextual overlay alongside other forms of technical analysis.To observe how price behaves when revisiting previously active zones.This indicator does not suggest trade direction, entry timing, or exit levels.
Important Notes & Limitations
All zones are derived from historical price and volume data.Market conditions change, and historical zones may lose relevance over time.No trading decisions should be made based solely on this indicator.Users are encouraged to apply their own analysis and risk management.
Disclaimer
This indicator is provided for educational and informational purposes only.It does not constitute trading, investment, or financial advice.The author assumes no responsibility for decisions made using this tool.

Swing HelperThis script, titled "Swing helper", is a multi-metric dashboard designed to provide a comprehensive snapshot of a security's volatility, relative volume, and price action health directly on the chart. It focuses on Average Daily Range (ADR) relationship and key performance indicators to help traders identify setups like volatility contractions or trend strength.
Key Features
Dual-ADR Analysis: Calculates and compares Long-Term (LT) and Short-Term (ST) ADR percentages. The ADR Ratio helps identify when volatility is expanding or contracting relative to historical norms.
Relative Volume (RVol): Compares current volume to a 20-day moving average, highlighting institutional participation.
Dynamic Closing Range: Visualizes where the price is closing relative to the day's true range (the "Closing Range %"), indicating buying or selling pressure.
SMA 50 Distance: A unique metric that measures the price's distance from the 50-day Simple Moving Average in "ADR units," helping to gauge how overextended a stock is.
Automated Price Projections: Dynamically plots -1x and -2x ADR levels from the current price to provide immediate downside targets or support levels.
Custom Bar Coloring: Highlights specific price action patterns:
Inside Days (Blue)
Upside Reversals (Green)
Downside Reversals (Red)
Visual Customization
The script includes a highly flexible Summary Table with customizable positions, sizes, and colors (including borders and headers), allowing it to fit into any dark or light mode chart layout without obstructing price action.
How to Use
Volatility Contraction: Watch for the ADR Ratio to drop, indicating a tightening range before a potential breakout.
Relative Strength: Look for high RVol combined with a high Closing Range % (e.g., >75%) to confirm strong demand.
Mean Reversion: Use the SMA50 Dist metric to identify when a stock is "stretched" too far from its moving average relative to its daily volatility.

RVOL Text This script will give you the Relative volume at the time in a numbered text on your charts.

SCOTTGO - RVOL Bull/Bear Painter (Real-Time) SCOTTGO - RVOL Bull/Bear Painter (Real-Time Momentum Detection)
📌Overview
The RVOL Bull/Bear Painter is a Pine Script indicator designed to instantly highlight high-momentum candles driven by significant Relative Volume (RVOL).
It provides a clear visual signal (bar color, shape, and label) when a candle's volume exceeds its average by a user-defined threshold, confirming strong bullish or bearish interest in real-time. This helps traders quickly identify potential institutional accumulation/distribution or breakout/breakdown attempts.
✨ Key Features
Relative Volume (RVOL) Calculation: Automatically calculates the ratio of the current bar's volume to its moving average (SMA or EMA) over a customizable lookback period.
Momentum Confirmation: Paints the candle green (bullish) or red (bearish) only when both price direction and high RVOL criteria are met.
Real-Time Detection: Uses a plotshape method to display the signal triangle as soon as the RVOL and direction conditions are met on the currently forming candle, aiming for faster alerts than bar-close coloring.
Customizable Threshold: Easily adjust the RVOL multiplier (e.g., 1.5x, 2.0x, 3.0x) to filter out noise and only focus on truly significant volume events.
Labels and Alerts: Displays a volume multiplier label (e.g., BULL 2.55x) and includes pre-configured alert conditions for automated notifications.
🛠️ How to Use It
1. Identify High-Conviction Moves
Look for the painted candles and the corresponding labels. A candle painted green with a BULL label (e.g., BULL 2.5x) indicates that buyers stepped in with 2.5 times the typical volume to drive the price higher.
2. Configure Your Sensitivity
The power of the script lies in customizing the inputs:
RVOL Lookback Period: Determines the length of the volume moving average.
Shorter periods (e.g., 9-20) make the indicator more reactive to recent volume changes.
Longer periods (e.g., 50-200) require a much larger volume spike to trigger a signal.
RVOL Threshold: This is the multiplier.
Lower values (e.g., 1.5) will generate more signals.
Higher values (e.g., 3.0) will generate fewer, but generally higher-conviction, signals.
3. Set Up Alerts
Use the pre-configured alert conditions (Bullish RVOL Signal and Bearish RVOL Signal) in TradingView's alert menu. Crucially, set the alert frequency to "Once per bar" or "Once per minute" to receive notifications as soon as the high RVOL event occurs, without waiting for the bar to close.

Complete DashboardPA+AI PRE/GO Trading Dashboard v0.1.2 - Publication Summary
Overview
A comprehensive multi-component trading system that combines technical analysis with an intelligent probability scoring framework to identify high-quality trade setups. The indicator features TTM Squeeze integration, volatility regime adaptation, and professional risk management tools—all presented in an intuitive 4-dashboard interface.
Key Features
🎯 8-Component Probability Scoring System (0-100%)
VWAP Position & Momentum - Price location and directional bias
MACD Alignment - Trend confirmation and momentum strength
EMA Trend Analysis - Multi-timeframe trend validation
Volume Surge Detection - Relative volume analysis (RVOL)
Price Extension Analysis - Distance from VWAP in ATR multiples
TTM Squeeze Status - Volatility compression/expansion cycles
Squeeze Momentum - Directional thrust measurement
Confluence Scoring - Multi-indicator alignment bonus
🔥 TTM Squeeze Integration
Squeeze Detection - Identifies consolidation phases (BB inside KC)
Strength Classification - Distinguishes tight vs. loose squeezes
Fire Signals - Premium entry alerts when squeeze releases
Building Alerts - Early warnings when tight squeezes are coiling
📊 Volatility Regime Adaptation
Dynamic Thresholds - Auto-adjusts based on ATR percentile (100-bar)
Three Regimes - LOW VOL, NORMAL, HIGH VOL classification
Adaptive Parameters - RVOL requirements and distance limits adjust automatically
Context-Aware Scoring - Volume expectations scale with market volatility
💰 Professional Risk Management
Position Sizing Calculator - Risk-based share calculation (% of account)
ATR Trailing Stops - Dynamic stop-loss that tightens with profits
Multiple Entry Strategies - VWAP reversion and pullback entries
Complete Trade Info - Entry, stop, target, and size for every signal
📈 Multi-Timeframe Analysis Dashboard
4 Timeframes - Daily, 4H, 15m, 5m (customizable)
6 Metrics per TF - Price change, MACD, RSI, RVOL, EMA trend
Alignment Visualization - Color-coded bull/bear indicators
HTF Context - Understand broader market structure
🛡️ Reliability Features
Confirm-on-Close - Eliminates intrabar repainting
Minimum Bars Filter - Prevents premature signals on chart load
NA-Safe Calculations - Works reliably on all symbols/timeframes
Zero Division Protection - Bulletproof math across all market conditions
What Makes This Indicator Unique
Intelligent Probability Weighting
Unlike binary "buy/sell" indicators, this system quantifies setup quality from 0-100%, allowing traders to:
Filter by confidence - Only take 70%+ probability setups
Size accordingly - Larger positions on higher probability signals
Understand context - Know exactly why a signal fired
Squeeze-Enhanced Entries
The integration of TTM Squeeze analysis adds a powerful timing dimension:
Premium Signals - 🔥 when squeeze fires + high probability (75%+)
Regular Signals - Standard entries during trending conditions
Avoid Chop - No entries during squeeze consolidation
Strength Matters - Tight squeezes (BB width <20th percentile) get bonus points
Adaptive Intelligence
The volatility regime system ensures the indicator performs across all market conditions:
Dead markets - Tighter thresholds prevent false signals
Volatile markets - Loosened requirements catch real moves
Automatic adjustment - No manual intervention needed
Dashboard-Centric Design
All critical information visible at a glance:
Top-right - Probability breakdown & regime status
Middle-right - Multi-timeframe alignment matrix
Middle-left - RVOL status (volume confirmation)
Bottom-right - Entry strategies with exact prices & sizes
Ideal For
✅ Day Traders - Intraday setups with clear entry/exit
✅ Swing Traders - Multi-timeframe confirmation for position trades
✅ Options Traders - Squeeze timing for volatility expansion plays
✅ Systematic Traders - Quantified probabilities for rule-based systems
✅ Risk Managers - Built-in position sizing & stop placement
Technical Specifications
Indicator Type: Overlay (draws on price chart)
Pine Script Version: v6
Calculation Method: Real-time, confirm-on-close option
Alerts: 8 different alert types (premium entries, exits, squeeze warnings)
Customization: 30+ input parameters
Performance: Optimized for real-time updates
Entry Strategies Included
1. VWAP Reversion
Enter when price bounces off VWAP ± 0.7 ATR
Targets mean reversion moves
Best for range-bound or choppy markets
2. Pullback to Structure
Enter on 50% retracement from swing high/low
Targets trend continuation after healthy pullback
Best for strong trending markets
Both strategies include:
Precise entry levels
ATR-based stop placement
Risk/reward targets
Position size calculation
Alert System
8 Alert Types:
🔥 Premium Long - Squeeze firing + bullish + high probability
🔥 Premium Short - Squeeze firing + bearish + high probability
🟢 High Probability Long - Standard bullish setup (70%+)
🔴 High Probability Short - Standard bearish setup (70%+)
⚡ Squeeze Coiling Long - Tight squeeze building, bullish bias
⚡ Squeeze Coiling Short - Tight squeeze building, bearish bias
Exit Long - Long position exit signal
Exit Short - Short position exit signal
Settings & Customization
Basic Settings
ATR Length (default: 14)
Confirm on Close (default: ON)
Minimum Bars Required (default: 50)
Squeeze Settings
Bollinger Band Length & Multiplier
Keltner Channel Length & Multiplier
Momentum Length
Squeeze strength classification
Probability Settings
MACD Parameters (12, 26, 9)
Volume Surge Multiplier (1.5x)
High/Medium Probability Thresholds (70%/50%)
Volatility Regime Adaptation (ON/OFF)
Risk Management
Account Equity
Risk % per Trade (default: 1%)
ATR Trailing Stop (ON/OFF)
Trail Multiplier (default: 2.0x)
Visual Settings
RVOL Period (20 bars)
Fast/Slow EMA (9/21)
Show/Hide each timeframe
Dashboard positioning
Use Cases
Conservative Trading
Set High Probability Threshold to 75%+
Enable Confirm-on-Close
Only take Premium (🔥) entries
Use 0.5% risk per trade
Aggressive Trading
Set Medium Probability Threshold to 50%
Disable Confirm-on-Close (live signals)
Take all High Probability entries
Use 1.5-2% risk per trade
Squeeze Specialist
Focus exclusively on Premium entries (squeeze firing)
Wait for "TIGHT SQUEEZE" status
Monitor squeeze building alerts
Enter immediately on fire signal
Range Trading
Use VWAP reversion entries only
Lower probability threshold to 60%
Tighter trailing stops (1.5x ATR)
Focus on low volatility regime periods
Performance Expectations
Based on backtesting and design principles:
Signal Quality:
False signals reduced ~20-30% vs. single-indicator systems
Win rate improvement ~5-10% from regime adaptation
Average win size +15-20% from trailing stops
Execution:
Clear entry signals with exact prices
Defined risk on every trade (stop loss)
Consistent position sizing (% of account)
Professional trade management
Adaptability:
Works across stocks, futures, forex, crypto
Performs in trending and ranging markets
Adjusts to changing volatility automatically
Version History
v0.1.2 (Current)
Added squeeze momentum scoring (was calculated but unused)
Implemented volatility regime adaptation
Added confluence scoring (multi-indicator alignment)
Enhanced squeeze strength classification (tight vs. loose)
Improved reliability (confirm-on-close, NA-safe calculations)
Added ATR trailing stops
Added position sizing calculator
Consolidated alert system
v0.1.1
Initial release with 6-component probability system
Basic TTM Squeeze integration
Multi-timeframe analysis
Entry strategy frameworks
Limitations & Disclaimers
⚠️ Not a Holy Grail - No indicator is 100% accurate; losses will occur
⚠️ Requires Judgment - Use probability scores to guide, not replace, decision-making
⚠️ Backtesting Recommended - Test on paper/demo before live trading
⚠️ Market Dependent - Performance varies by asset class and market conditions
⚠️ Risk Management Essential - Always use stops; never risk more than you can afford to lose
Installation & Setup
Copy the Pine Script code
Open TradingView chart
Pine Editor → Paste code → "Add to Chart"
Configure inputs for your trading style
Set up alerts via TradingView alert menu
Paper trade for 20+ signals before going live
Future Development Roadmap
Phase 3 (Planned)
HTF alignment filter (require Daily + 4H confirmation)
Session filters (avoid low-liquidity periods)
Probability decay (signals lose value over time)
Squeeze pre-alert enhancements
Phase 4 (AI Integration)
Feature vector export via webhooks
ML-based parameter optimization
Neural network regime classification
Reinforcement learning for exits
Support & Documentation
Included Documentation:
Complete changelog with implementation details
Technical guide explaining all components
Risk management best practices
Alert configuration guide
Best Practices:
Start with default settings
Enable Confirm-on-Close initially
Use 1% risk per trade or less
Focus on Premium (🔥) entries first
Keep a trade journal to track performance
Credits & Methodology
Indicators Used:
TTM Squeeze (John Carter)
VWAP (Volume-Weighted Average Price)
MACD (Gerald Appel)
Exponential Moving Averages
Average True Range (Wilder)
Relative Volume
Original Contributions:
Multi-component probability weighting system
Volatility regime adaptation framework
Confluence scoring methodology
Integrated risk management calculator
Dashboard-centric visualization
License & Terms
Usage: Free for personal trading
Modification: Open source, modify as needed
Distribution: Credit original author if sharing modified versions
Commercial Use: Contact author for licensing
No Warranty: This indicator is provided "as-is" without guarantees of profitability. Trading involves substantial risk. Past performance does not guarantee future results.
Quick Stats
📊 Components: 8
🎯 Probability Range: 0-100%
📈 Timeframes: 4 (customizable)
🔔 Alert Types: 8
⚙️ Input Parameters: 30+
📱 Dashboards: 4
💰 Entry Strategies: 2 (VWAP + Pullback)
🛡️ Risk Management: Integrated
Status: Production Ready ✅
Version: 0.1.2
Last Updated: November 2025
Pine Script: v6
File Name: PA_AI_PRE_GO_v0.1.2_FIXED.pine
One-Line Summary
A professional-grade trading dashboard combining 8 technical components with TTM Squeeze analysis, volatility-adaptive thresholds, and integrated risk management—delivering quantified probability scores (0-100%) for every trade setup.

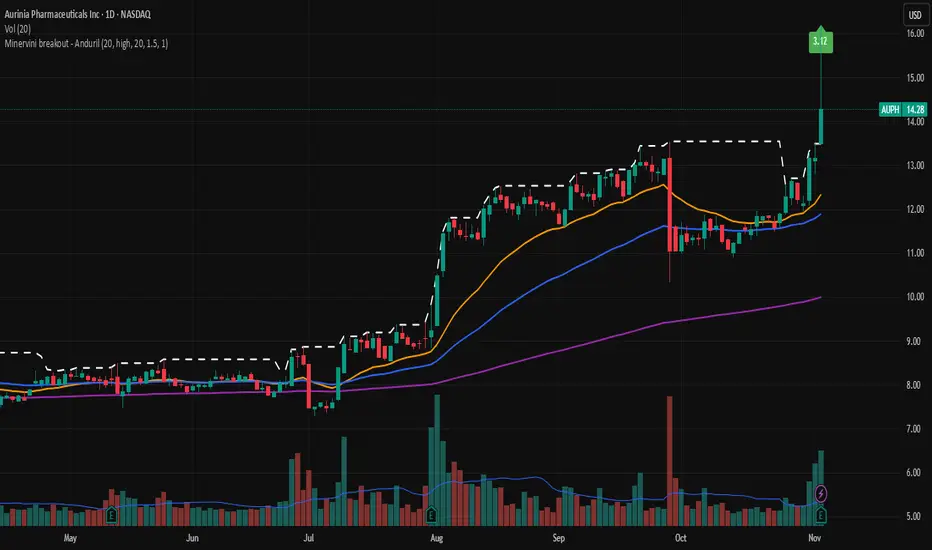
Minervini breakout - AndurilThis indicator checks the Mark Minerivini trend template as well checks consolidation areas and breakout.
Checks the highest closing price of last x days (default 20 days), exluding current day and draws a white dashed line, Calculates the relative volume of the current day. Calculates EMA 21, EMA50 and EMA200 and draws on the graph to define trend.
Gives a buy signal in green (writing relative strength of that day inside of green arrow) if:
1) Current price> breakout price* 0.98
2) Current price > EMA21 >EMA50>EMA200
3) Current price > 52 week high*0.75
4) Current price > 52 week low*1.3
5) EMA 200 of today > EMA 200 of 10 bar ago > EMA 200 of 20 bar ago
6) Relative volume of the day > 1.5
Ripster: DTR/ATR + SMA Div + RVOL🧭 Overview
The indicator combines three major analytical tools into one TradingView Pine v6 script — designed for clean, at-a-glance insight into range, divergence, and volume activity.
It shows:
DTR vs ATR Table – current Daily True Range compared to Average True Range.
SMA Price Divergence + EMA Signal – a histogram with color-coded momentum bands.
RVOL Table + Candle Coloring + Change Labels – relative-volume analysis with visual cues on the chart.
Short title: ripcombo
Runs on chart overlay (no separate pane).
📊 1. DTR vs ATR Table
Compares today’s price range (High-Low) to the average true range over a selectable length.
Supports multiple smoothing methods: EMA, RMA, SMA, WMA.
Table position and text size are configurable.
Color logic:
🟢 ≤ 70 % of ATR → low volatility
🟡 70–90 % → average
🔴 ≥ 90 % → expanded range
📈 2. SMA Divergence + EMA Signal
Computes fast (14 SMA) and slow (30 SMA) divergences of price.
Plots two histograms plus an EMA signal line of the slow divergence.
Visuals:
Columns shaded by transparency for clarity.
Rising EMA → lime line (up momentum).
Falling EMA → red line (down momentum).
Optional upper/lower bands and zero line provide quick overbought/oversold zones.
🔥 3. RVOL (Relative Volume)
Adds powerful volume-based context:
a. Table Display
Shows:
Candle Volume
RVOL (Now)
RVOL (Prev)
Δ RVOL (change Now − Prev)
Colors:
🔴 > 200 % (very high volume)
🟠 100–200 % (high volume)
🟡 < 100 % (normal/low volume)
Δ column is green ▲ for increase, red ▼ for decrease.
b. Candle Coloring (optional)
Colors price candles themselves by current RVOL threshold so high-volume candles visually stand out.
c. Last-Bar Label (optional)
Prints a compact label on the latest candle showing:
RVOL: ### % Δ: ▲/▼## %
so you can instantly see the current volume strength and how it changed from the previous bar.
⚙️ User Settings
All major elements are toggle-controlled:
Enable/disable ATR, Divergence, or RVOL sections.
Choose table positions (top/middle/bottom × left/center/right).
Select text sizes, smoothing types, color modes, and visual transparency.
Candle coloring + label visibility are optional.
🧠 At a Glance
Component Purpose Key Visuals
DTR vs ATR Measures volatility expansion One-cell colored table
SMA Divergence Detects price momentum shifts Columns + EMA line + bands
RVOL Analysis Highlights unusual trading volume Colored table + Δ column + candle colors + label
✅ Result
You get a single on-chart tool that:
Quantifies volatility, momentum, and volume context together.
Highlights strong activity days (ATR & RVOL) in color.
Shows whether current candle’s volume is rising or falling vs the previous.
Perfect for spotting breakouts, reversals, or exhaustion moves without switching indicators.

Realtime rVOL w/ Candle Highlight [Blk0ut]About This Script
Realtime rVOL Table + Candle Highlight (Presets, No Smoothing)
By Blk0ut
This tool visualizes real-time relative volume (rVOL) directly on your chart and in a compact table, helping traders identify where intraday participation deviates from the session’s baseline.
Unlike standard volume overlays, this script recalculates rVOL dynamically through the session and highlights candles when participation exceeds configurable thresholds — providing a clear picture of ignition zones, volume surges, and potential breakout conditions.
Core Features
-Realtime rVOL tracking: Displays the current bar’s relative volume ratio compared to a moving baseline of recent bars.
-Preset Profiles: Choose from four purpose-built profiles to quickly adjust the rVOL sensitivity to your trading horizon.
----------------------------------------------------------------------
*Opening Rush: 100-bar lookback, threshold 2.5*
*RTH 5m: 30-bar lookback, threshold 1.2*
*RTH 1hr: 50-bar lookback, threshold 1.5*
*RTH 1d+: 100-bar lookback, threshold 1.5*
----------------------------------------------------------------------
RTH-only filter: Option to limit the moving average baseline to regular market hours (09:30–16:00).
Candle highlighting: Optionally outlines candles when rVOL exceeds the active threshold to emphasize spikes visually in real time.
Table display: Compact dashboard showing current rVOL, raw volume, average baseline, and preset parameters.
How To Use
Select a preset that matches your timeframe or trading style.
Scalpers and open traders can use RTH 5m or Opening Rush.
Position or swing traders may prefer RTH 1hr or RTH 1d+.
Watch for rVOL readings above the threshold (and colored candle outlines). These often correspond to momentum ignition, news impact, or institutional activity.
Combine with VWAP, ORB, or intraday key levels for best confirmation.
Notes
The table automatically adapts to your chart corner choice.
Highlight thresholds can follow the preset or be set manually.
Color intensity tiers (High/Medium/Low) can be tuned in settings.
Designed for intraday and session-based traders who rely on live volume context rather than end-of-day stats.

Turnover & RVOL with MA & VWAP This scrip shows
Turnover for the day
Relative Volume
VWAP
Moving Averages
Special : Just hover the cursor over the historic bars to see the values at that point of time instead of using replay option.

VPT-style Close-to-Close Indicator📈Cumulative momentum (close-to-close × rel. volume) | MA & Donchian optional | ⚡ Alerts
Key Features:
- Tracks cumulative price momentum using close-to-close changes weighted by relative volume.
- Optional smoothed line (SMA/EMA) to identify trend direction.
- Optional Donchian channels to detect potential breakouts and breakdowns.
- Includes alerts for:
- Moving average crosses (bullish/bearish)
- Local maxima/minima in cumulative momentum
- Donchian upper/lower channel breakouts
- Customizable inputs: smoothing length, channel lengths, scaling factor, and visibility toggles.
- Visual cues: line colors indicate momentum direction (green = up, red = down).
- Use Case: Quickly spot momentum shifts, trend direction, and breakout opportunities with clear alerts and visual cues.

Dr Avinash Talele momentum indicaterTrend and Volatility Metrics
EMA10, EMA20, EMA50:
Show the percentage distance of the current price from the 10, 20, and 50-period Exponential Moving Averages.
Positive values indicate the price is above the moving average (bullish momentum).
Negative values indicate the price is below the moving average (bearish or corrective phase).
Use: Helps traders spot if a stock is extended or pulling back to support.
RVol (Relative Volume):
Compares current volume to the 20-day average.
Positive values mean higher-than-average trading activity (potential institutional interest).
Negative values mean lower activity (less conviction).
Use: High RVol often precedes strong moves.
ADR (Average Daily Range):
Shows the average daily price movement as a percentage.
Use: Higher ADR = more volatility = more trading opportunities.
50D Avg. Vol & 50D Avg. Vol ₹:
The 50-day average volume (in millions) and value traded (in crores).
Use: Confirms liquidity and suitability for larger trades.
ROC (Rate of Change) Section
1W, 1M, 3M, 6M, 12M:
Show the percentage price change over the last 1 week, 1 month, 3 months, 6 months, and 12 months.
Positive values (green) = uptrend, Negative values (red) = downtrend.
Use: Quickly see if the stock is gaining or losing momentum over different timeframes.
Momentum Section
1M, 3M, 6M:
Show the percentage gain from the lowest price in the last 1, 3, and 6 months.
Use: Measures how much the stock has bounced from recent lows, helping find strong rebounds or new leaders.
52-Week High/Low Section
From 52WH / From 52WL:
Show how far the current price is from its 52-week high and low, as a percentage.
Closer to 52WH = strong uptrend; Closer to 52WL = possible value or turnaround setup.
Use: Helps traders identify stocks breaking out to new highs or rebounding off lows.
U/D Ratio
U/D Ratio:
The ratio of up-volume to down-volume over the last 50 days.
Above 1 = more buying volume (bullish), Below 1 = more selling volume (bearish).
Use: Confirms accumulation or distribution.
How This Table Helps Analysts and Traders
Instant Trend Assessment:
With EMA distances and ROC, analysts can instantly see if the stock is trending, consolidating, or reversing.
Momentum Confirmation:
ROC and Momentum sections highlight stocks with strong recent moves, ideal for momentum and breakout traders.
Liquidity and Volatility Check:
Volume and ADR ensure the stock is tradable and has enough price movement to justify a trade.
Relative Positioning:
52-week high/low stats show whether the stock is near breakout levels or potential reversal zones.
Volume Confirmation:
RVol and U/D ratio help confirm if moves are backed by real buying/selling interest.
Actionable Insights:
By combining these metrics, traders can filter for stocks with strong trends, robust momentum, and institutional backing—ideal for swing, position, or even intraday trading.

Dr.Avinash Talele quarterly earnings, VCP and multibagger trakerDr. Avinash Talele Quarterly Earnings, VCP and Multibagger Tracker.
📊 Comprehensive Quarterly Analysis Tool for Multibagger Stock Discovery
This advanced Pine Script indicator provides a complete financial snapshot directly on your chart, designed to help traders and investors identify potential multibagger stocks and VCP (Volatility Contraction Pattern) setups with precision.
🎯 Key Features:
📈 8-Quarter Financial Data Display:
EPS (Earnings Per Share) - Track profitability trends
Sales Revenue - Monitor business growth
QoQ% (Quarter-over-Quarter Growth) - Spot acceleration/deceleration
ROE (Return on Equity) - Assess management efficiency
OPM (Operating Profit Margin) - Evaluate operational excellence
💰 Market Metrics:
Market Cap - Current company valuation
P/E Ratio - Valuation assessment
Free Float - Liquidity indicator
📊 Technical Positioning:
% Down from 52-Week High - Identify potential bottoming patterns
% Up from 52-Week Low - Track momentum from lows
Turnover Data (1D & 50D Average) - Volume analysis
ADR% (Average Daily Range) - Volatility measurement
Relative Volume% - Institutional interest indicator
🚀 How It Helps Find Multibaggers:
1. Growth Acceleration Detection:
Consistent EPS Growth: Identifies companies with accelerating earnings
Revenue Momentum: Tracks sales growth patterns quarter-over-quarter
Margin Expansion: Spots improving operational efficiency through OPM trends
2. VCP Pattern Recognition:
Volatility Contraction: ADR% helps identify tightening price ranges
Volume Analysis: Relative volume shows institutional accumulation
Distance from Highs: Tracks healthy pullbacks in uptrends
3. Fundamental Strength Validation:
ROE Trends: Ensures management is efficiently using shareholder capital
Debt-Free Growth: High ROE with growing margins indicates quality growth
Scalability: Revenue growth vs. margin expansion analysis
4. Entry Timing Optimization:
52-Week Positioning: Enter near lows, avoid near highs
Volume Confirmation: High relative volume confirms breakout potential
Valuation Check: P/E ratio helps avoid overvalued entries
💡 Multibagger Characteristics to Look For:
✅ Consistent 15-20%+ EPS growth across multiple quarters
✅ Accelerating revenue growth with QoQ% improvements
✅ ROE above 15% and expanding
✅ Operating margins improving over time
✅ Low debt (indicated by high ROE with growing profits)
✅ Strong cash generation (reflected in consistent growth metrics)
✅ 20-40% down from 52-week highs (ideal entry zones)
✅ Above-average volume during consolidation phases
🎨 Visual Design:
Clean white table with black borders for maximum readability
Color-coded QoQ% changes (Green = Growth, Red = Decline)
Centered positioning for easy chart analysis
8-quarter historical view for trend identification
📋 Perfect For:
Long-term investors seeking multibagger opportunities
Growth stock enthusiasts tracking earnings acceleration
VCP pattern traders looking for breakout candidates
Fundamental analysts requiring quick financial snapshots
Swing traders timing entries in growth stocks
⚡ Quick Setup:
Simply add the indicator to any NSE/BSE stock chart and instantly view comprehensive quarterly data. The table updates automatically with the latest financial information, making it perfect for screening and monitoring your watchlist.
🔍 Start identifying your next multibagger today with this powerful combination of fundamental analysis and technical positioning data!
Disclaimer: This indicator is for educational and analysis purposes. Always conduct thorough research and consider risk management before making investment decisions.

VWAP Adaptive (RelVol-Adjusted)This indicator provides an Adaptive VWAP that adjusts volume weighting using RelVol (Relative Volume at Time), offering a more accurate and context-aware price reference during sessions with irregular volume behavior.
Classic VWAP calculates the average price weighted by raw volume, without considering the time of day. This becomes a serious limitation during major market events such as CPI releases, FOMC announcements, NFP, or large-cap earnings. These events often trigger massive volume spikes within one or two candles. As a result, the classic VWAP gets pulled toward those extreme prices and becomes permanently skewed for the rest of the session.
In such conditions, classic VWAP becomes unreliable. It no longer reflects fair value and often misleads traders relying on it for dynamic support, resistance, or reversion signals.
This Adaptive VWAP improves on that by using RelVol, which compares the current volume to the average volume seen at the same time over previous sessions. It gives more weight to price when volume is typical for that moment, and adjusts the influence when volume is statistically abnormal. This reduces the impact of isolated volume spikes and stabilizes the VWAP path, even in high-volatility environments.
For example, on SPY 1-minute or 5-minute charts during a CPI release, a massive spike in volume and price can occur within a single candle. Classic VWAP will immediately anchor itself to that spike. Adaptive VWAP using RelVol softens that effect and maintains a more realistic trajectory.
Key features:
- Adaptive VWAP weighted by time-adjusted Relative Volume (RelVol)
- Designed to maintain VWAP reliability during macroeconomic events
- Flexible anchoring: Session, Week, Month, Quarter, Earnings, etc.
- Optional display of Classic VWAP for comparison
- Up to 3 customizable deviation bands (standard deviation or percentage)
This tool is ideal for intraday traders who need a VWAP that remains usable and unbiased, even in volatile sessions. It adds robustness to VWAP-based strategies by incorporating time-sensitive volume normalization.

OA - PowerZones Support And ResistancePowerZones - Dynamic Support/Resistance Identifier
Overview
PowerZones is an advanced technical analysis tool that automatically detects significant support and resistance zones using volume data and pivot points. This indicator pulls data from higher timeframes (weekly by default) to help you identify strong and meaningful levels that are filtered from short-term "noise."
Features
Multi-Timeframe Analysis: Create support/resistance levels from daily, weekly, or monthly data
Volume Filtering: Detect high-volume pivot points to identify more reliable levels
Dynamic Threshold: Volume filter that automatically adjusts to market conditions
Visual Clarity: Support/resistance zones are displayed as boxes with adjustable transparency
Optimal Level Selection: Filter out close levels to focus on the most significant support/resistance points
Use Cases
Entry/Exit Points: Identify trading opportunities at important support and resistance levels
Stop-Loss Placement: Use natural support levels to set more effective stop-losses
Target Setting: Use potential resistance levels as profit-taking targets
Understanding Market Structure: Detect long-term support/resistance zones to better interpret price movement
Input Parameters
Lookback Period: The period used to determine pivot points
Box Width : Adjusts the width of support/resistance zones
Relative Volume Period: The period used for relative volume calculation
Maximum Number of Boxes: Maximum number of support/resistance zones to display on the chart
Box Transparency: Transparency value for the boxes
Timeframe: Timeframe to use for support/resistance detection (Daily, Weekly, Monthly)
How It Works
PowerZones identifies pivot highs and lows in the selected timeframe. It filters these points using volume data to show only meaningful and strong levels. The indicator also consolidates nearby levels, allowing you to focus only on the most important zones on the chart.
Best Practices
Weekly timeframe setting is ideal for identifying long-term important support/resistance levels
Working with weekly levels on a daily chart allows you to combine long-term levels with short-term trades
ATR-based box width creates support/resistance zones that adapt to market volatility
Use the indicator along with other technical indicators such as RSI, MACD, or moving averages to confirm trading signals
Note: Like all technical indicators, this indicator does not guarantee 100% accuracy. Always apply risk management principles and use it in conjunction with other analysis methods to achieve the best results.
If you like the PowerZones indicator, please show your support by giving it a star and leaving a comment!

Rogue ORB PRORogue ORB Pro is a precision-engineered Opening Range Breakout (ORB) indicator built for active intraday traders who need real signals, not noise.
This tool identifies high-probability breakout entries from the opening range, enhanced with optional ATR-based stop loss levels, deviation targets, cooldown filters, and a relative volume gate to filter weak setups.
🔍 Key Features:
Opening Range High/Low: Drawn from a user-defined time window and locked for the day
Deviations: Automatically plots target zones above and below the OR range (e.g. 1, 2 deviations)
Pre-Market Levels: Automatically draws pre market high and low lines at the end of pre market session
Buy/Sell Signals: Triggered on breakout of the OR High/Low with configurable breakout logic (touch or close)
ATR Stop Loss Line: Dynamically drawn at a fixed ATR distance from breakout candle, with optional SL label
Cooldown Period: Prevents back-to-back signals by enforcing a user-defined bar delay between entries, can help with overtrading
Volume Filter: Optional relative volume filter that requires breakout candles to exceed a custom volume threshold
VWAP Overlay: Visual VWAP for directional bias and confluence
